RISD Fall 2016 EFS Design
Generative Art: Pi
For the project, different programs and algorithms were created in Processing to visualize as an paradoxical effort to make sense of "randomness". The project was inspired by the film, Pi(1998), written and directed by Darren Aronofsky. Each program maps the portion of Pi using different strategies and visual elements.
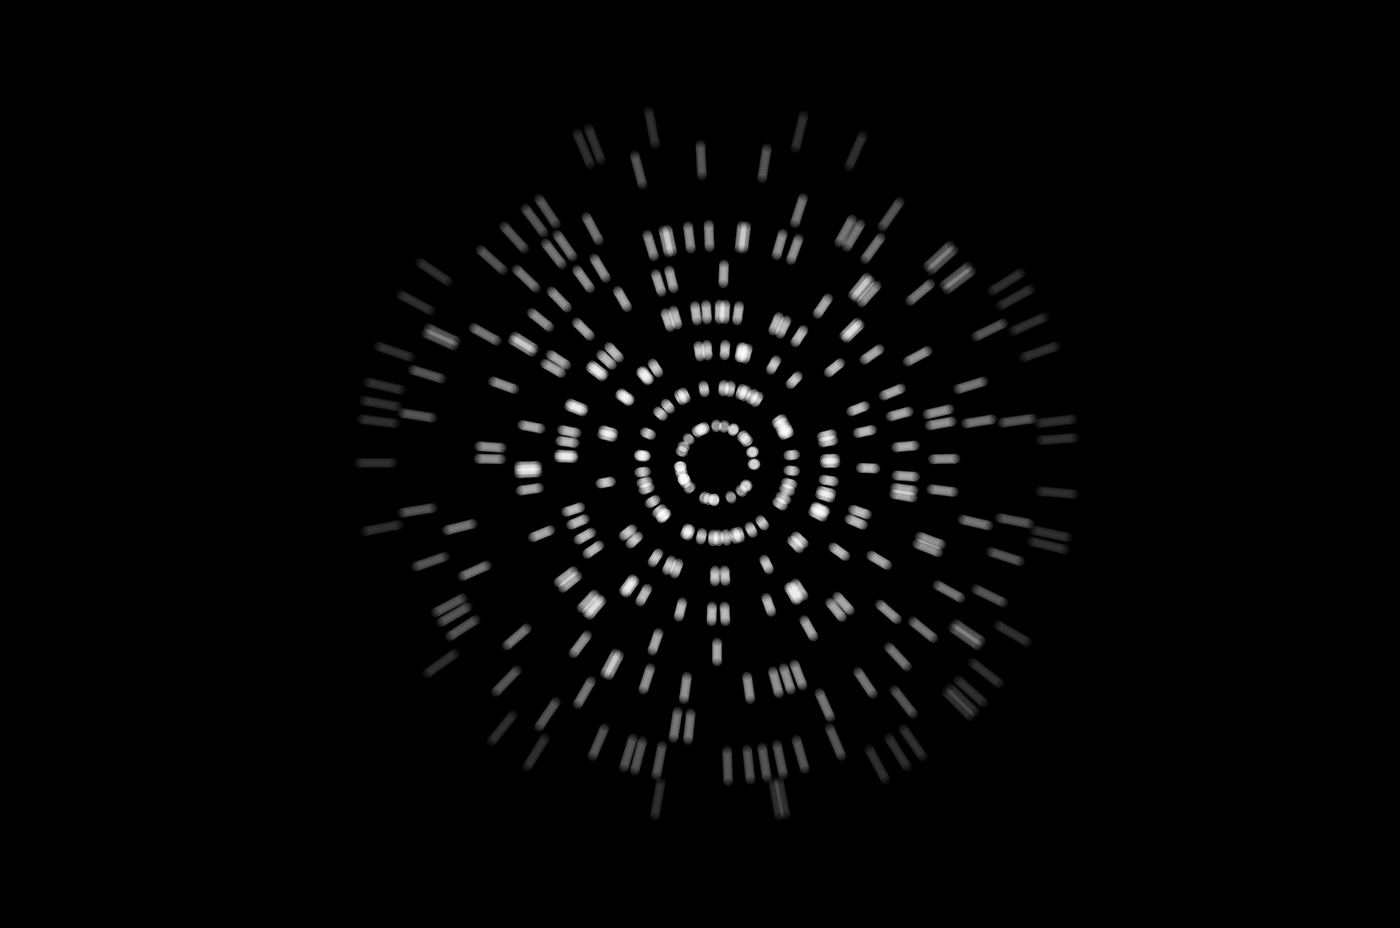
• 1 •
This image was created by assigning the value of each decimal digit of pi to a radius. According to the order of place value(large to small), each digit is presented originally as a dot, in a circular formation. A larger digit value would be associated with a larger radius, a dimmer appearance and a longer "shadow". (code presented above)
• 2 •
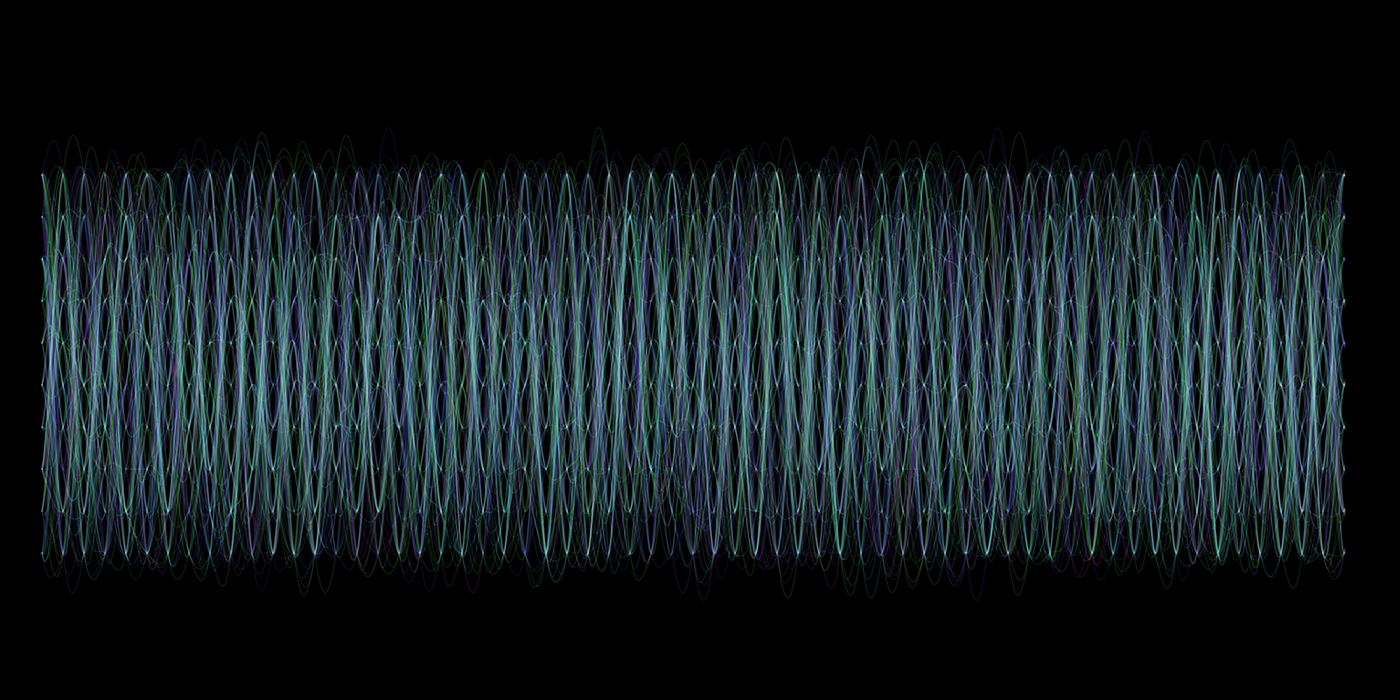
In this algorithm, the each digit is assigned to what resembles a coordinate - (digit place, place value). A curve is drawn through these coordinates, from left to right. When the curve ends on the right side of the canvas, it continues from the left. A gradient is added to the curve to present the history of its path. The graph visualizes the irrationality of pi and is visualized as the beauty of a irregular gradient.
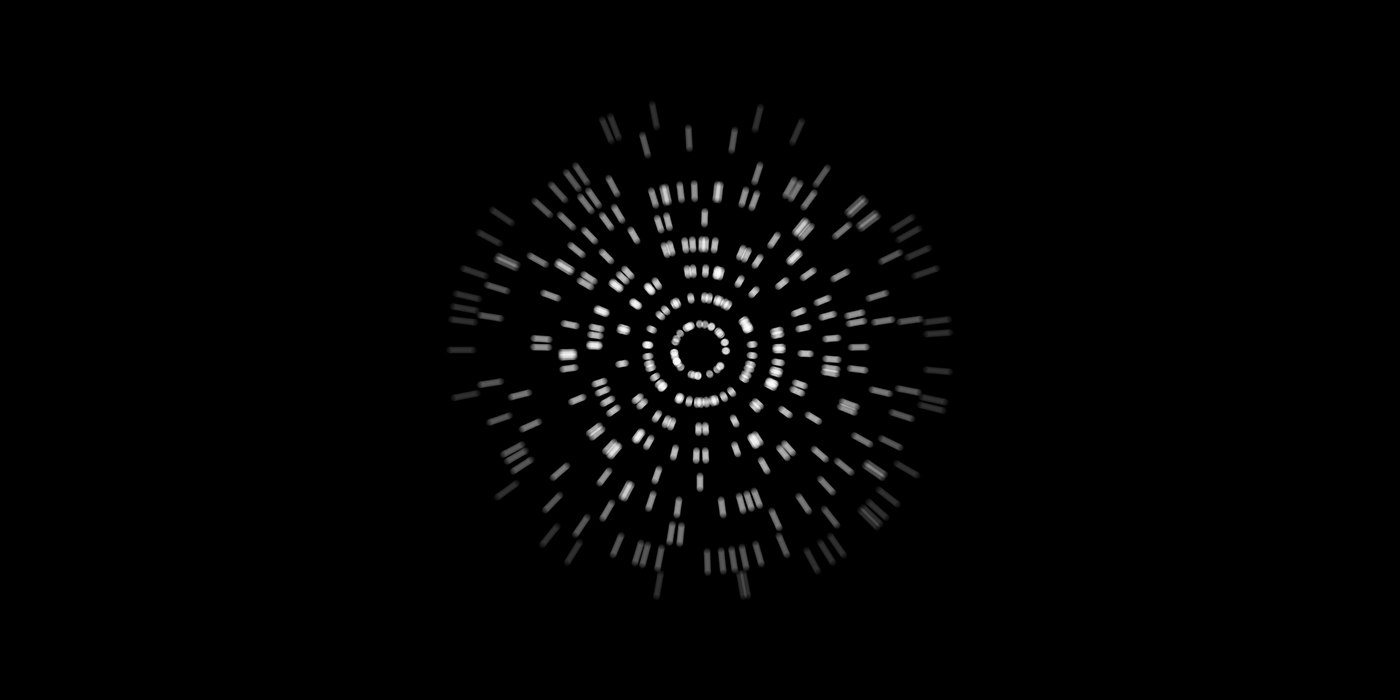
• 3 •

This code also assigns the value of each decimal digit of pi to a distance. Lines connect the central point to each point, towards an angle in association to the place of the digit. The cumulative effect of the low transparency of each point creates areas of different shades.
THANKS FOR WATCHING!


