This poster was designed to visualize data of the volume levels of a pigeon coop over a period of time. The illustration was created using traditional media, then manipulated using Photoshop and Illustrator.
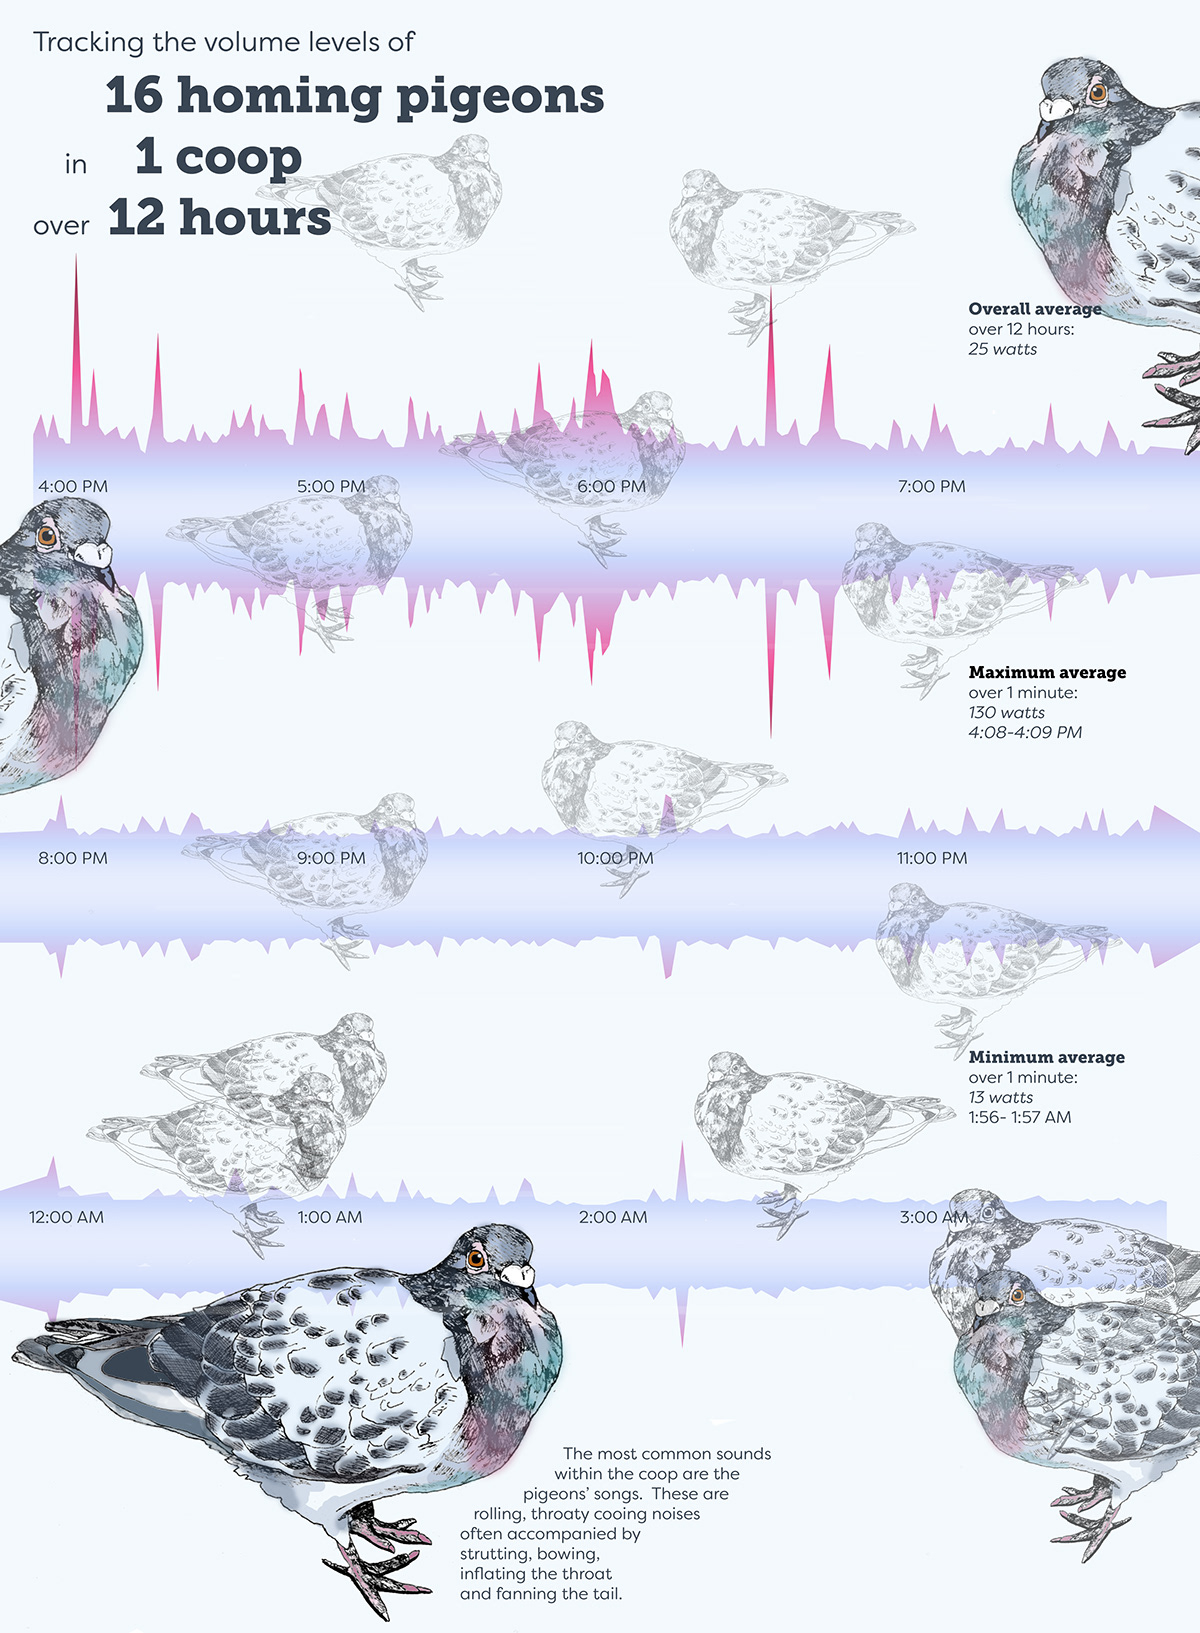
The data was collected by installing an Arduino microphone sensor into the coop itself. A program was coded to collect a data point each second of the coop's volume in watts.
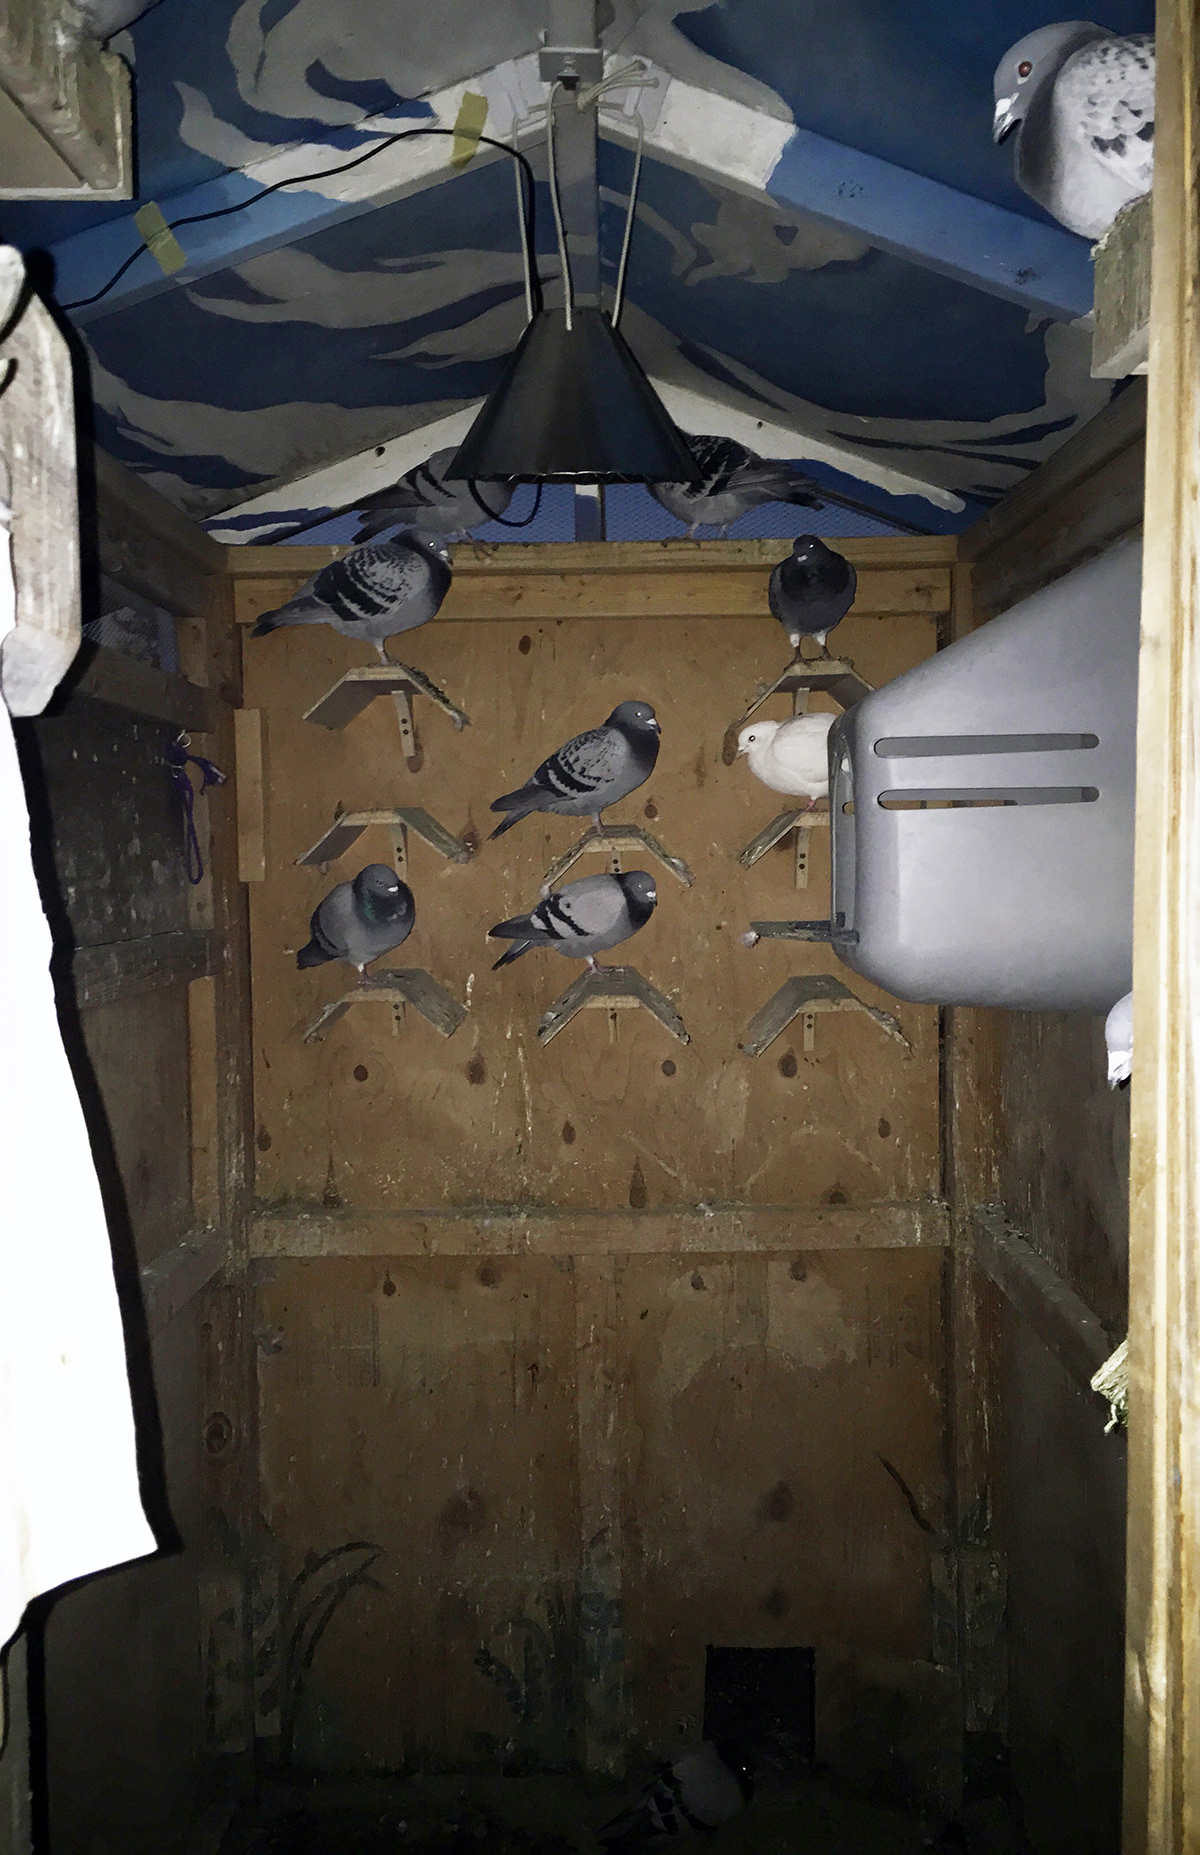
Special thanks to the RISD Pigeon Club, students and pigeons, for making this project possible.
Thank you for viewing!