
Our client asked GroupVisual.io to design a marketing tool that could visualize their unique internet routing technology. The client tracked the latency performance (among other metrics) of internet carriers, and choose a route from source to destination that was the fastest at the moment. Our client is constantly testing the speed of carriers from sources to destinations all over the world to dynamically choose the fastest route. Our task was to visualize this switching with historic data.
An initial wireframe option presented to the client.
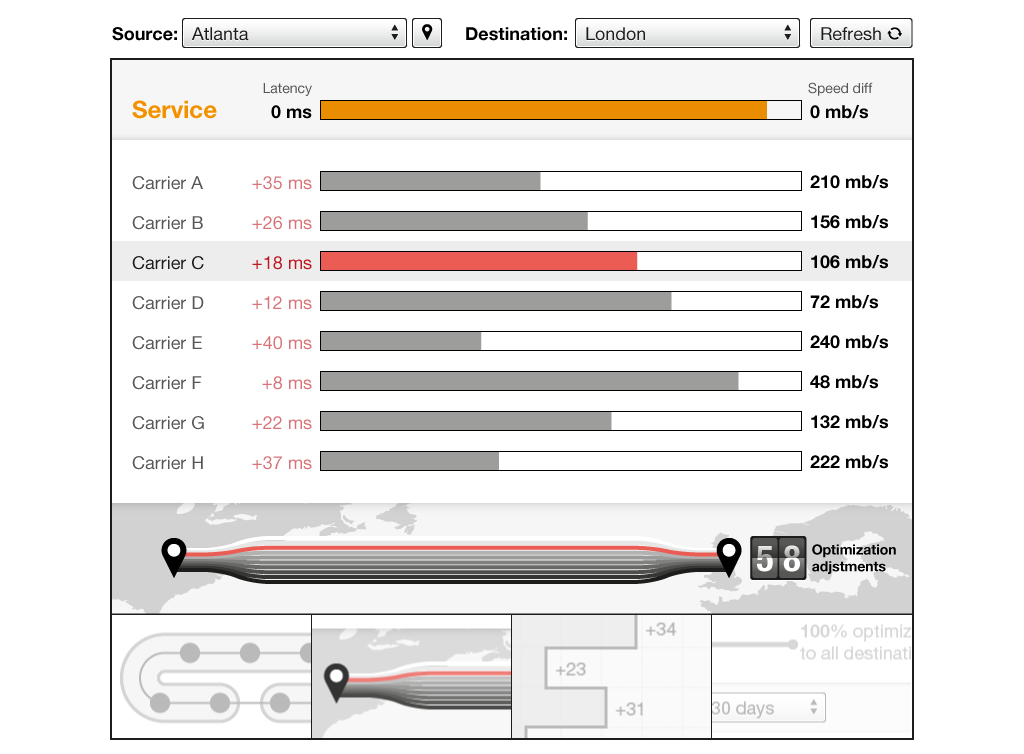
The wireframe was fleshed out into a drawing with a first-pass at look-and-feel.

The client was also intrigued by an alternate direction being developed in parallel....

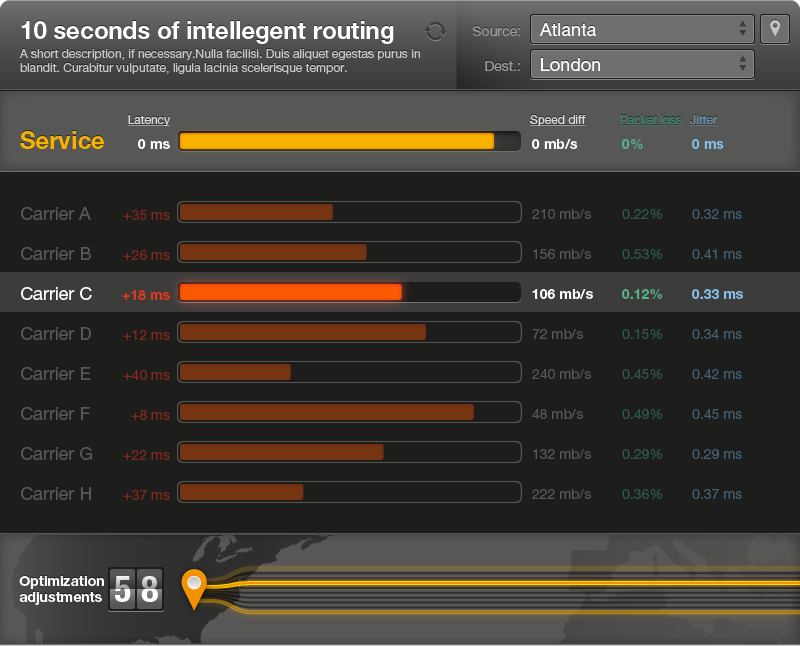
...so we combined the two into a new design direction.

We refined the look-and-feel and began to demonstrate how the visualization could be animated.


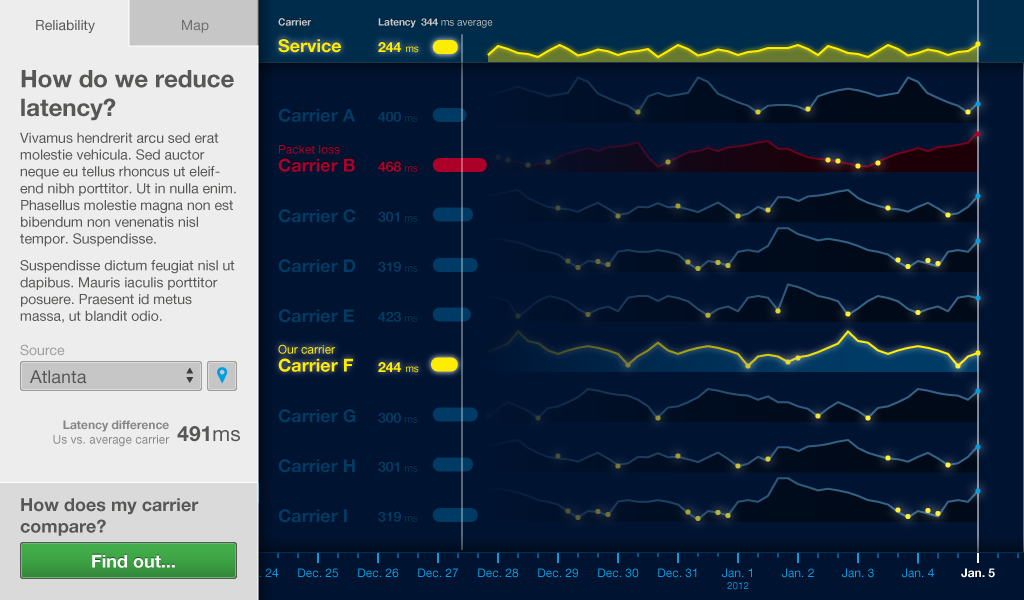
We experimented with a variety of ways of visualizing latency on the y-axis of the charts over a few design cycles. We eventually settled on bar charts: they are familiar, easy to read, and most importantly, establish a constant baseline.


We even experimented with 3d isometric and oblique methods to display the data. Even though the client was really excited by this direction, it proved too difficult to achieve technically.

This project was designed with the team at GroupVisual.io.


