


About
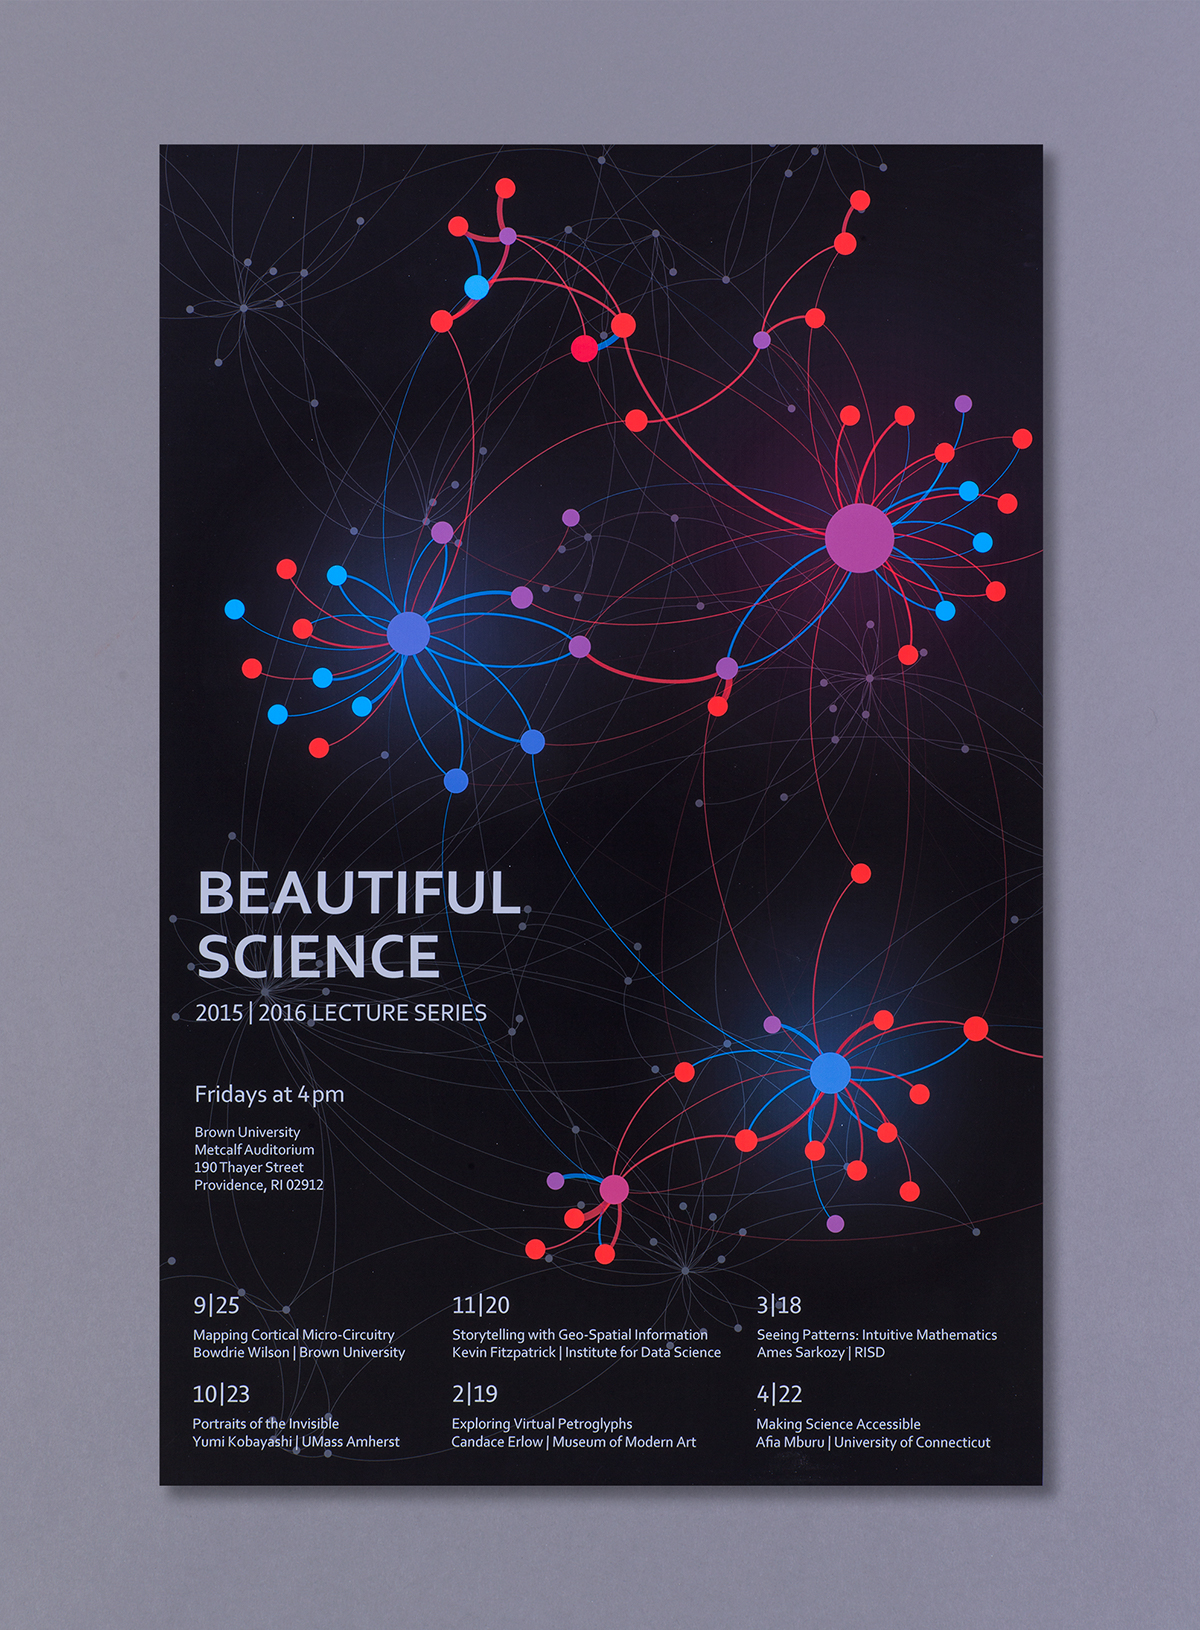
For this self-guided Final Studio project I created a network visualization of statistically estimated connections between neurons in a localized region of a rat’s brain. To do this I learned Gephi, an open source network analysis tool, and reacquainted myself with coding to format the data. Given the data and a set of parameters, Gephi algorithmically laid out the structure of the network. I used color to indicate excitatory versus inhibitory connections between nodes (neurons), line weight to illustrate connection strength, and node size to illustrate a cell’s number of connections. Connections run clockwise from source to target cell.
After creating the visualization I designed two applications for it: a lecture series poster advertising a (fictional) set of talks at the intersection of science, art and visualization, and an annotated fold-out figure to accompany a scientific journal article.
20 x 30 inches (poster); 17 x 11 inches (journal figure)
Typeface: Corbel
Course: Final Projects Studio, Spring 2016
Instructor and Program Advisor: Dina Zaccagnini Vincent
Rhode Island School of Design, Division of Continuing Education
Graphic Design Certificate Program
photo credit: Allyson Barth and Shane Gutierrez