Hi Res 3D render of the London District, all buildings extruded to a constant plane. Base plan for socioeconomic data to be added.

Hebin Population Density Render

London PTAL Accessibility Analysis

Socioeconomic Data extruded as bars

UK wide population density graphic
The below graphic shows socioeconomic data in a much more vibrant and engaging form than standard chloropleth mapping. Extruding bars based on the number of workers for two different airports shows a more creative way of displaying socioeconomic data and location analytics
Here is a link to my companies response to the recent London Runway expansion reports: http://www.bartonwillmore.co.uk/resources/much-more-than-a-runway/
More of this to come hopefully...


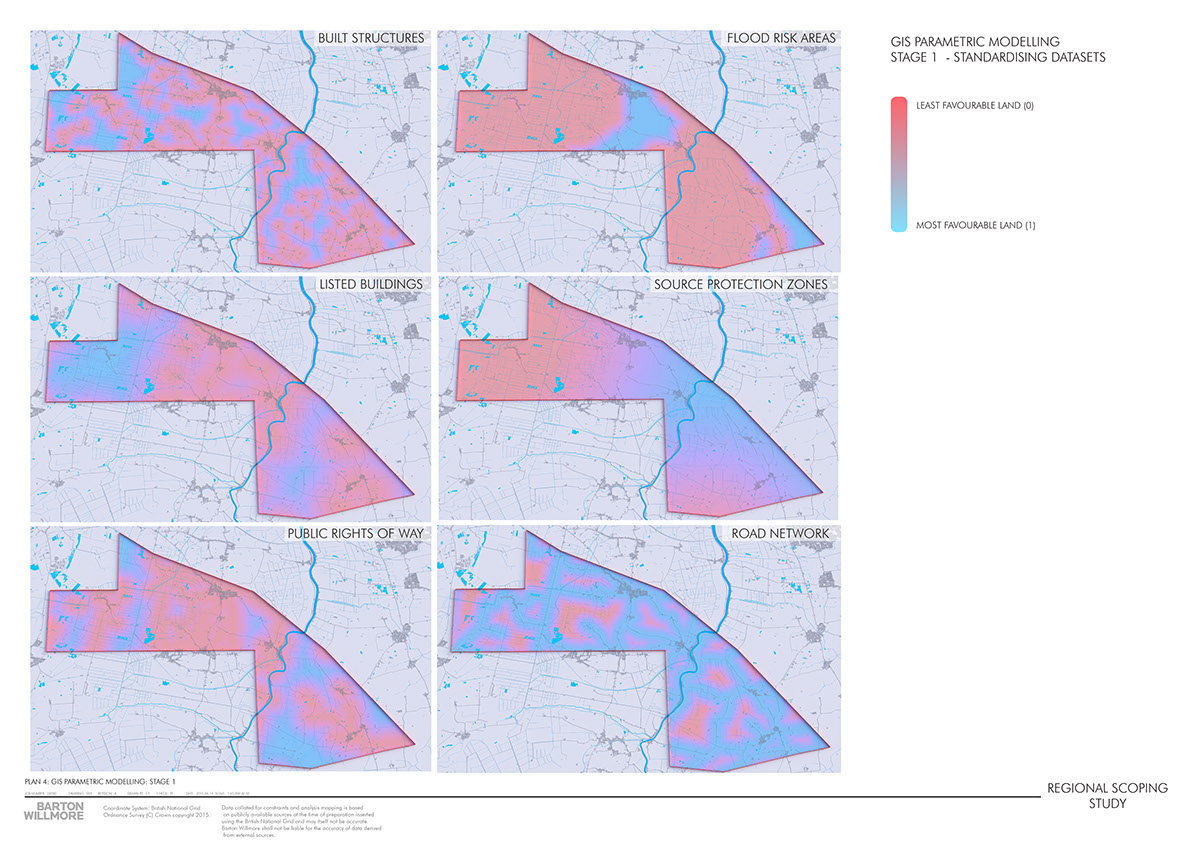
The next image is a bit more technical but I thought using a slight 3d tilt and rendering the images in a dedicated 3d graphics package creates a much stronger image than some of the standard mapping softwares can provide. Granted it takes longer...