Corriere della Sera – La Lettura
From Vincent to Theo
Artwork for Visual Data, the column on "La Lettura", the cultural supplement on the Sunday edition of "Corriere Della Sera".
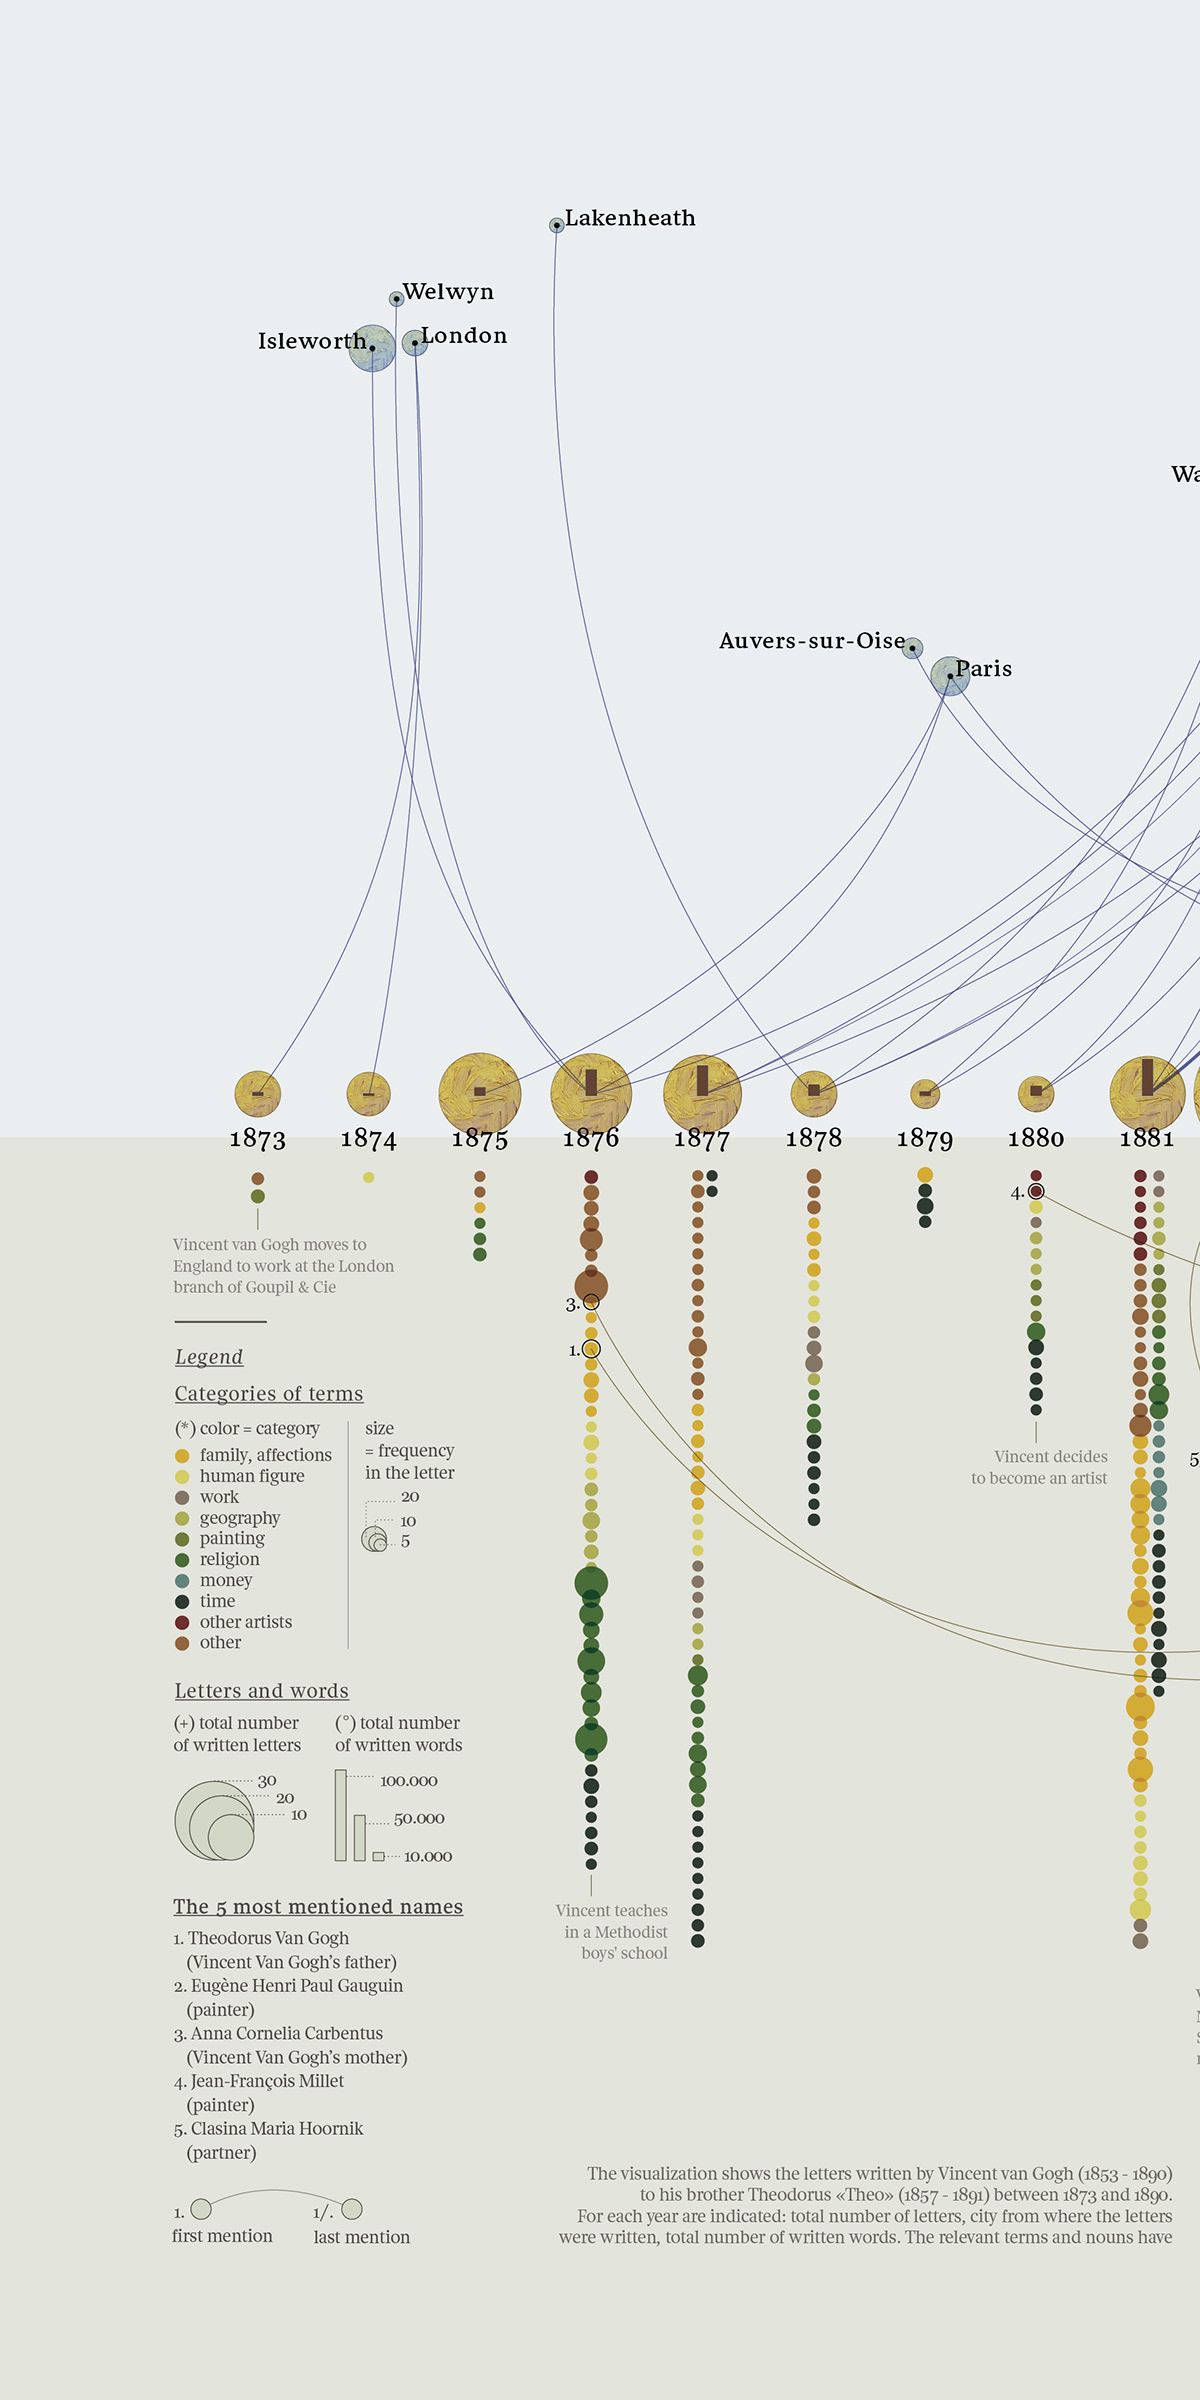
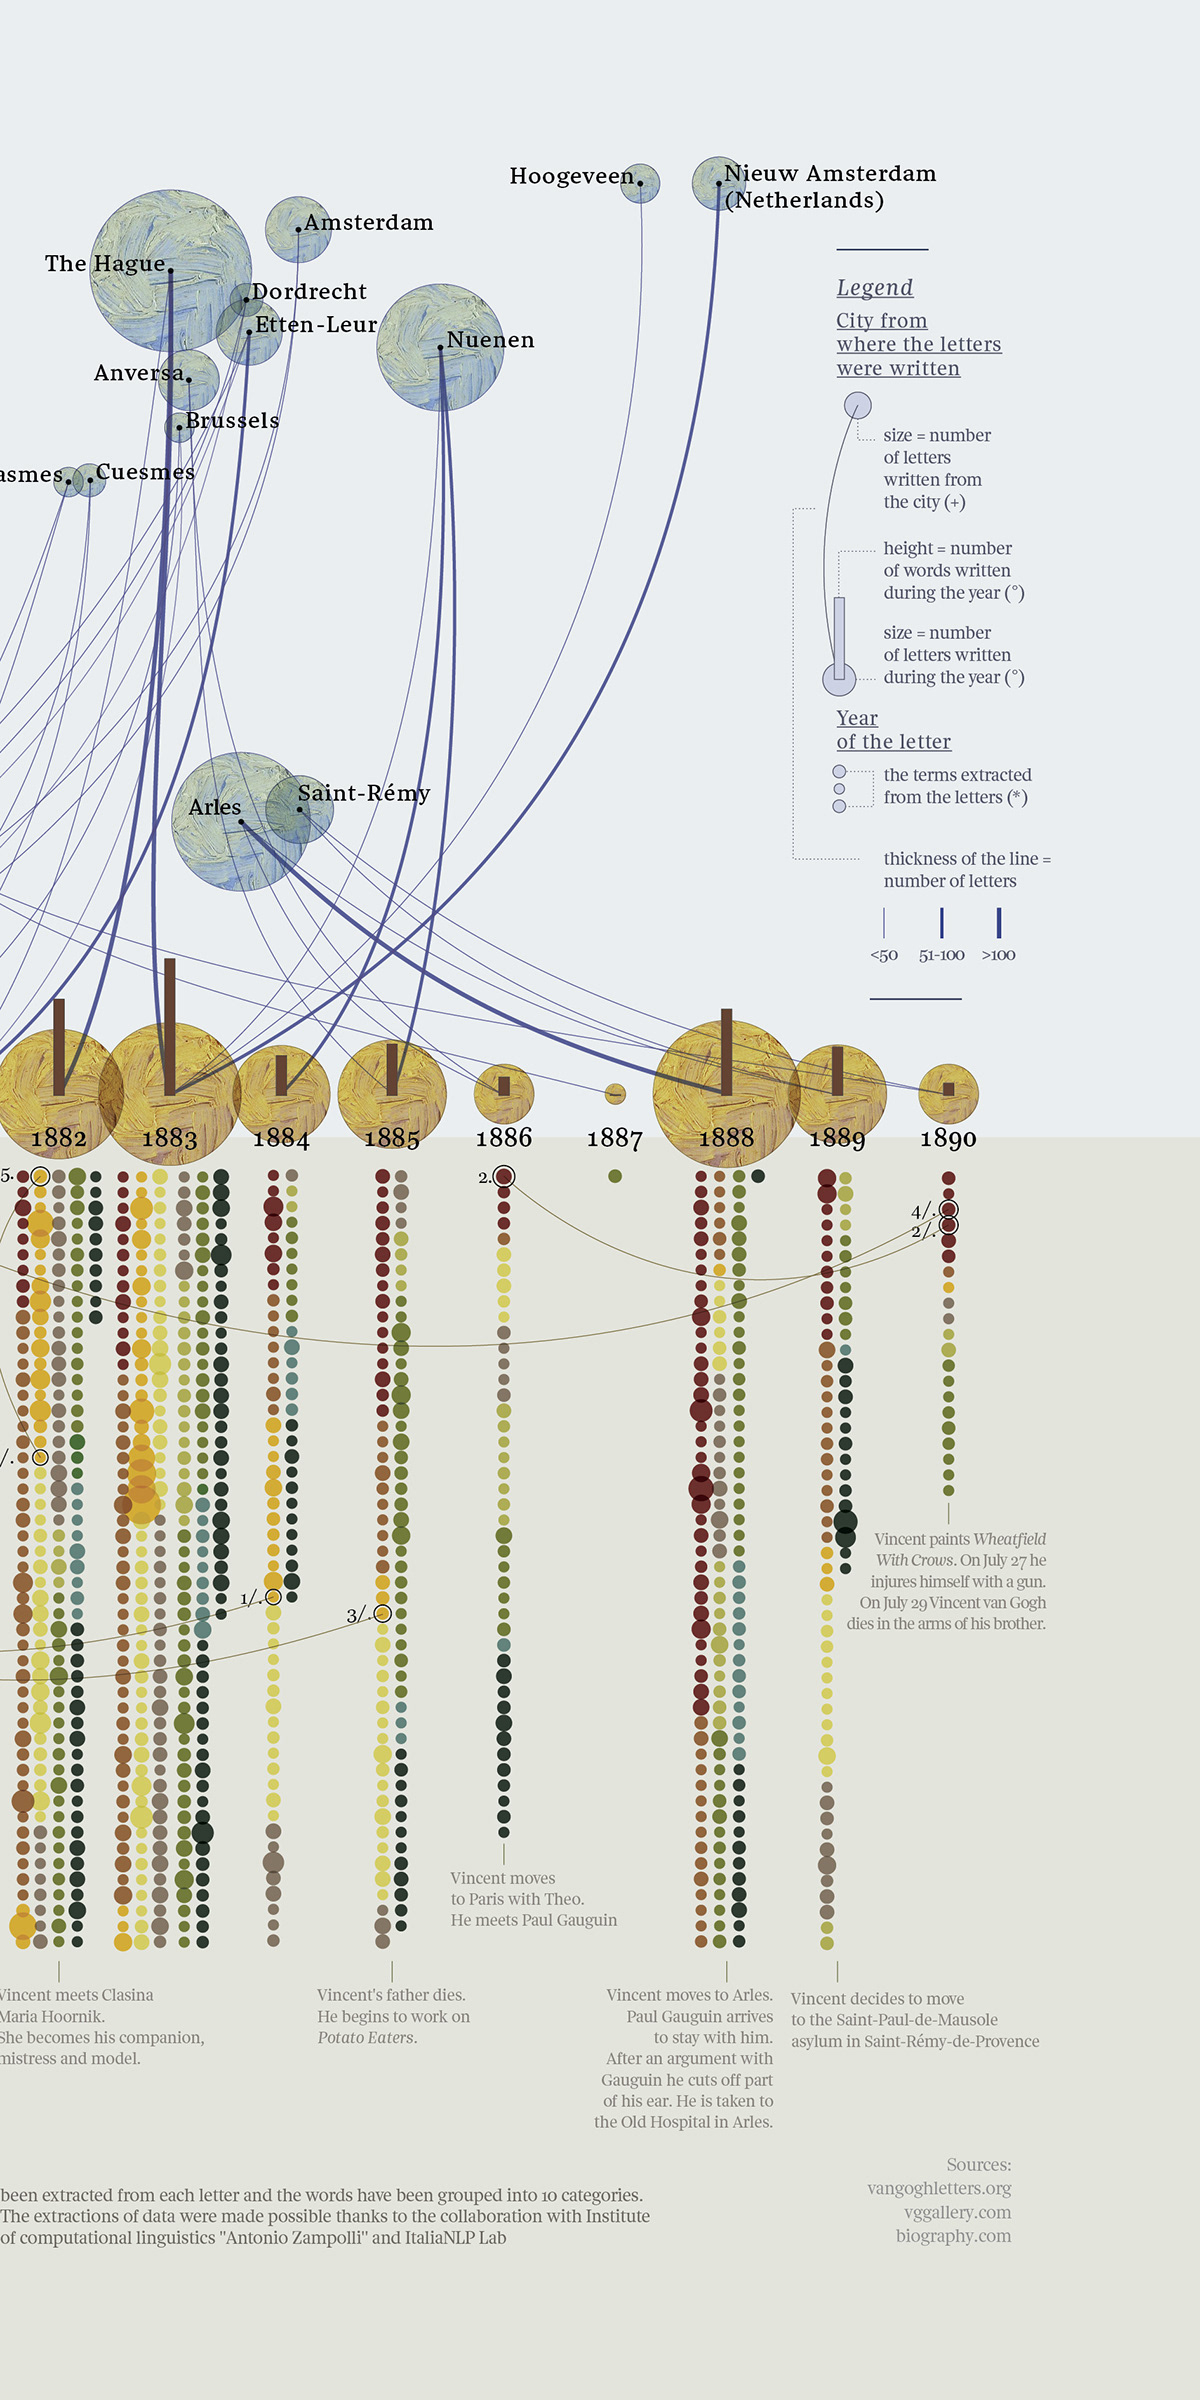
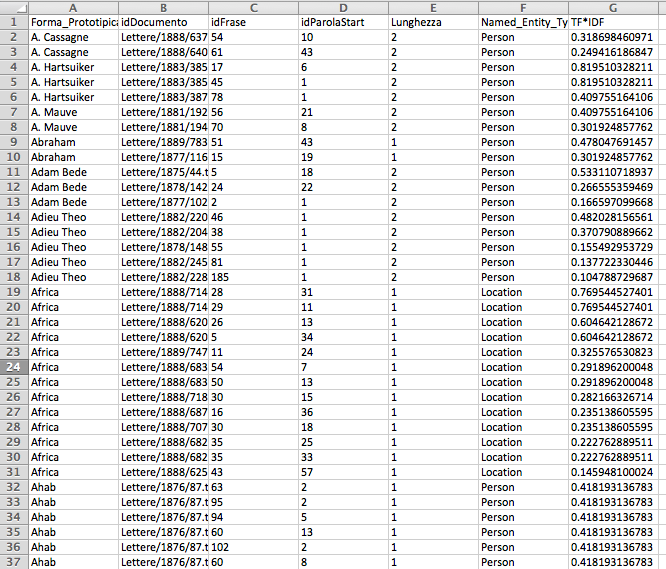
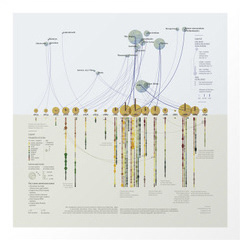
The visualization is a visual analysis of the letters written by Vincent van Gogh to his brother Theodorus «Theo» between 1873 and 1890.
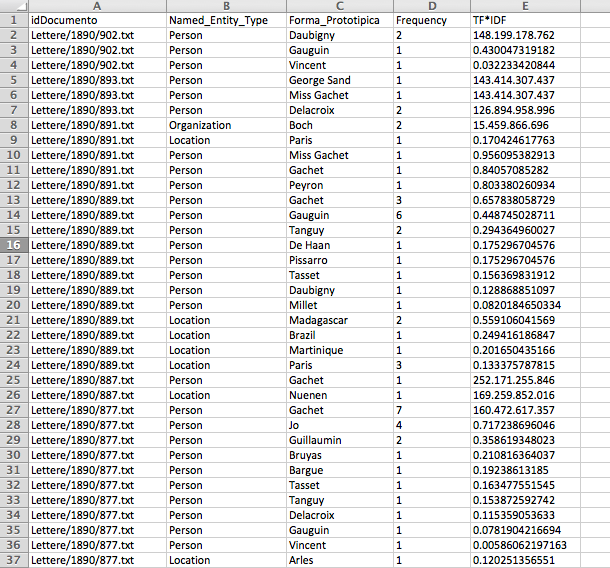
For each letter has been made an automatic extraction of linguistic and domain-specific information, thanks to the collaboration with Institute of computational linguistics "Antonio Zampolli" and ItaliaNLP Lab.
The visualization is a visual analysis of the letters written by Vincent van Gogh to his brother Theodorus «Theo» between 1873 and 1890.
For each letter has been made an automatic extraction of linguistic and domain-specific information, thanks to the collaboration with Institute of computational linguistics "Antonio Zampolli" and ItaliaNLP Lab.
For each year are indicated: total number of letters, city from where the letters were written, total number of written words. The relevant terms and nouns have been extracted from each letter and the words have been grouped into 10 categories.
This analysis allows to explore the correspondence between Vincent van Gogh and his brother Theo, the topics and the flows of letters.
This analysis allows to explore the correspondence between Vincent van Gogh and his brother Theo, the topics and the flows of letters.
Sources:
vangoghletters.org
vggallery.com
vangoghletters.org
vggallery.com
A project by Federica Fragapane.
Data extraction by ItaliaNLP Lab.
Data extraction by ItaliaNLP Lab.
Visualization and details


Art print available on Society6!
Data
The data extraction has been made by ItaliaNLP Lab.
Palette and Textures
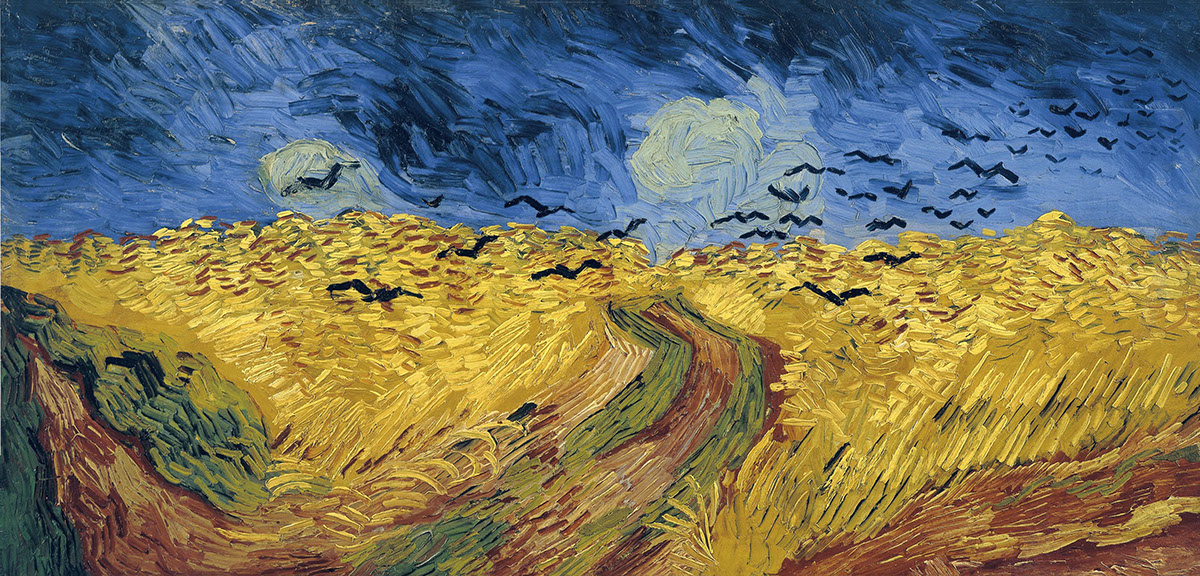
Colors and textures have been selected from Vincent van Gogh's painting Wheatfield with Crows

Legend

Italian version

You can buy the artwork on Society6!